
California spent nineteen years cutting vehicle emissions harder than almost anywhere else in the country. The result, on paper, is a clear win: a 65% drop in statewide exposure to PM2.5 from on-road vehicles between 2000 and 2019.
Koolik and colleagues' 2024 study in Science Advances asked a question the headline number doesn't answer: a win for whom?
Two numbers, two stories
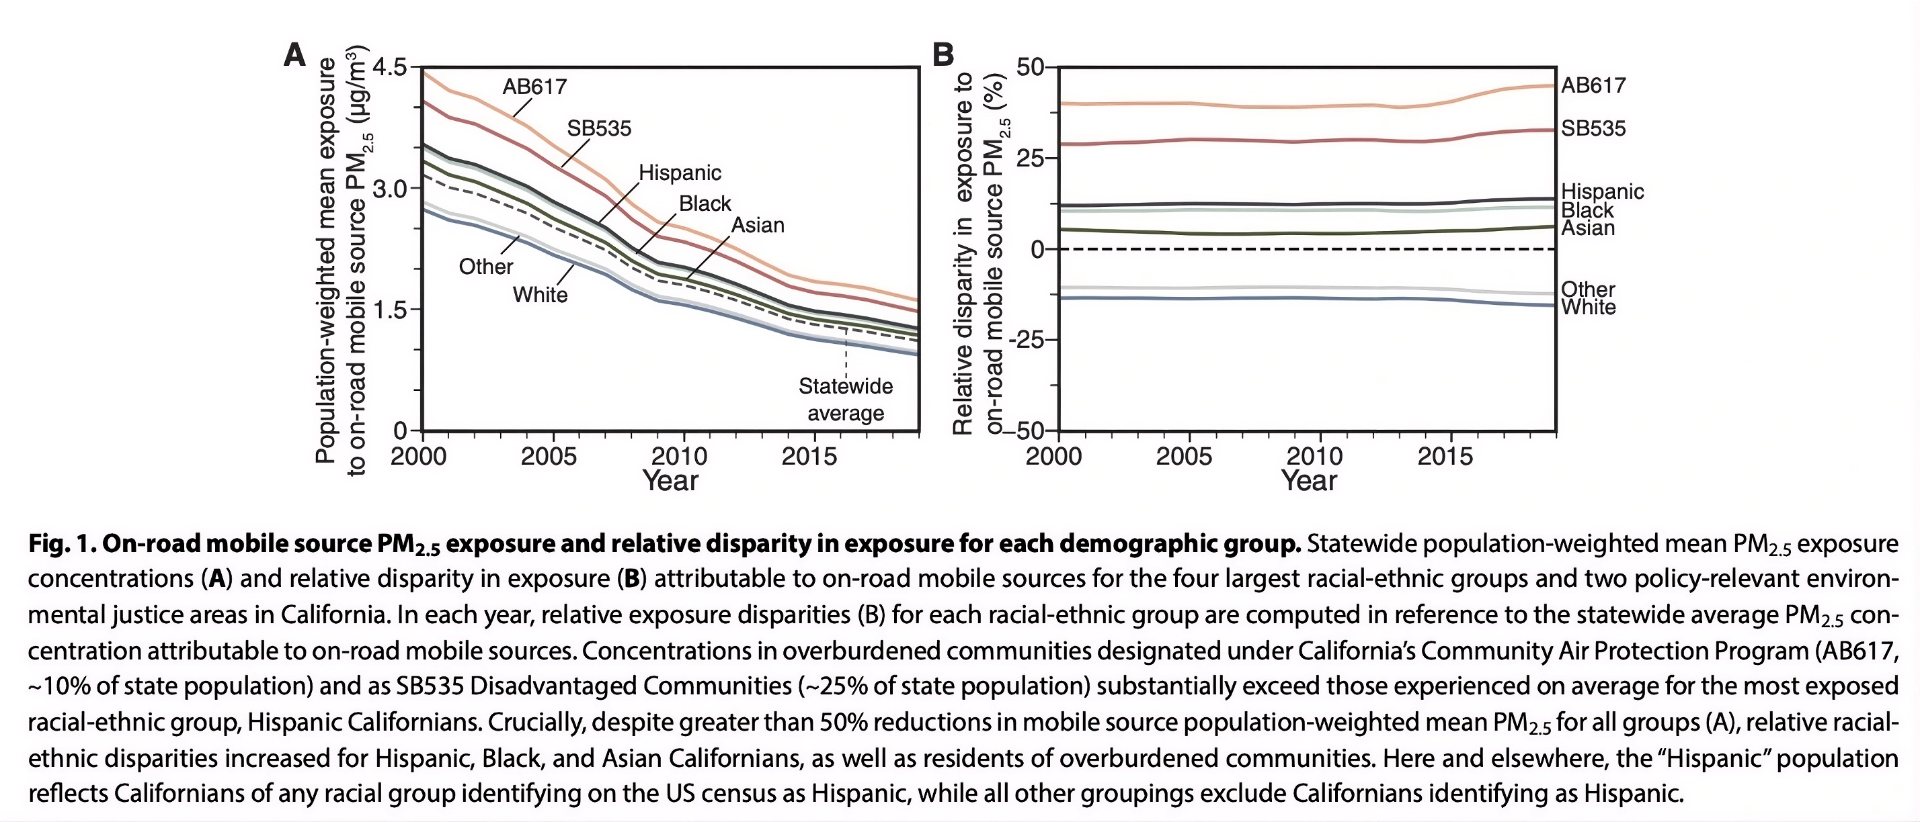
The researchers tracked exposure two different ways. The first is absolute — how many micrograms per cubic meter did people actually breathe, and how did that change over time? The second is relative — how does each group's exposure compare to the statewide average, and did that gap close?
On the first measure, everyone improved. Hispanic, Black, Asian, and white Californians all saw their exposure drop by more than half.
On the second measure, almost nothing moved. The gap between the most-exposed group (Hispanic Californians) and the least-exposed group (white Californians) widened slightly, from 30% in 2000 to 35% in 2019.
Both numbers are true. They just tell different stories about who the policy actually worked for.
The same people, more concentrated at the top
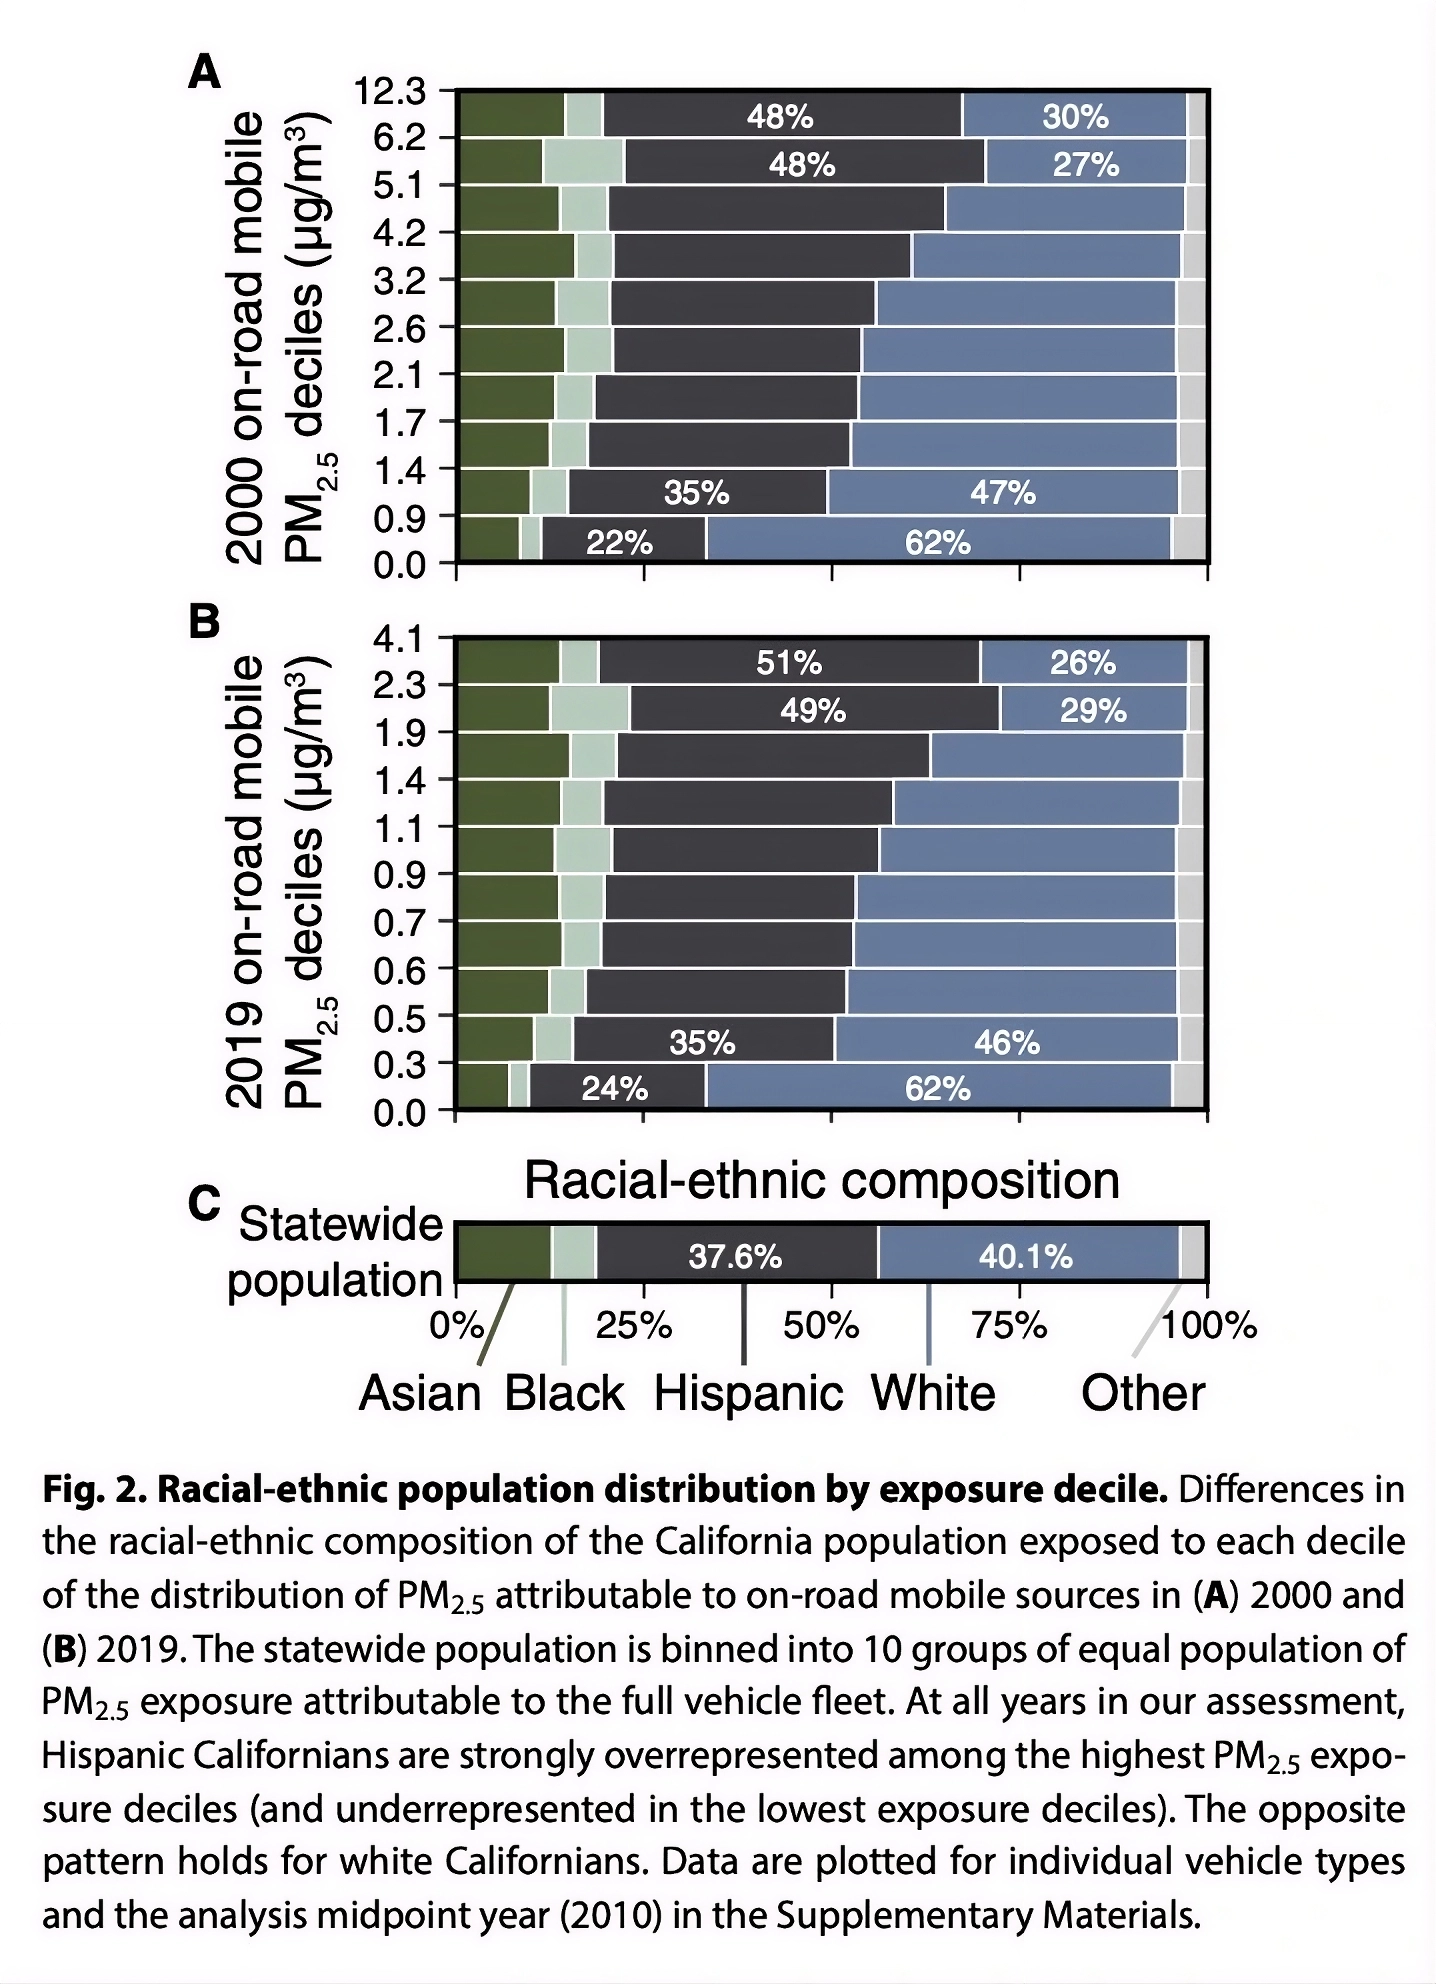
The researchers sorted the entire California population into ten groups, from least to most exposed, and tracked who ended up where.
In 2000, the most-polluted tenth of the state was 47.9% Hispanic. By 2019, that figure had climbed to 50.8% — even though Hispanic residents make up only 37.6% of California's population overall. White Californians moved the opposite direction: overrepresented in the cleanest tenth of the state in both years, underrepresented at the top.
Two decades of aggressive policy. Same pattern, slightly sharper.
Not all vehicles disparate the same way
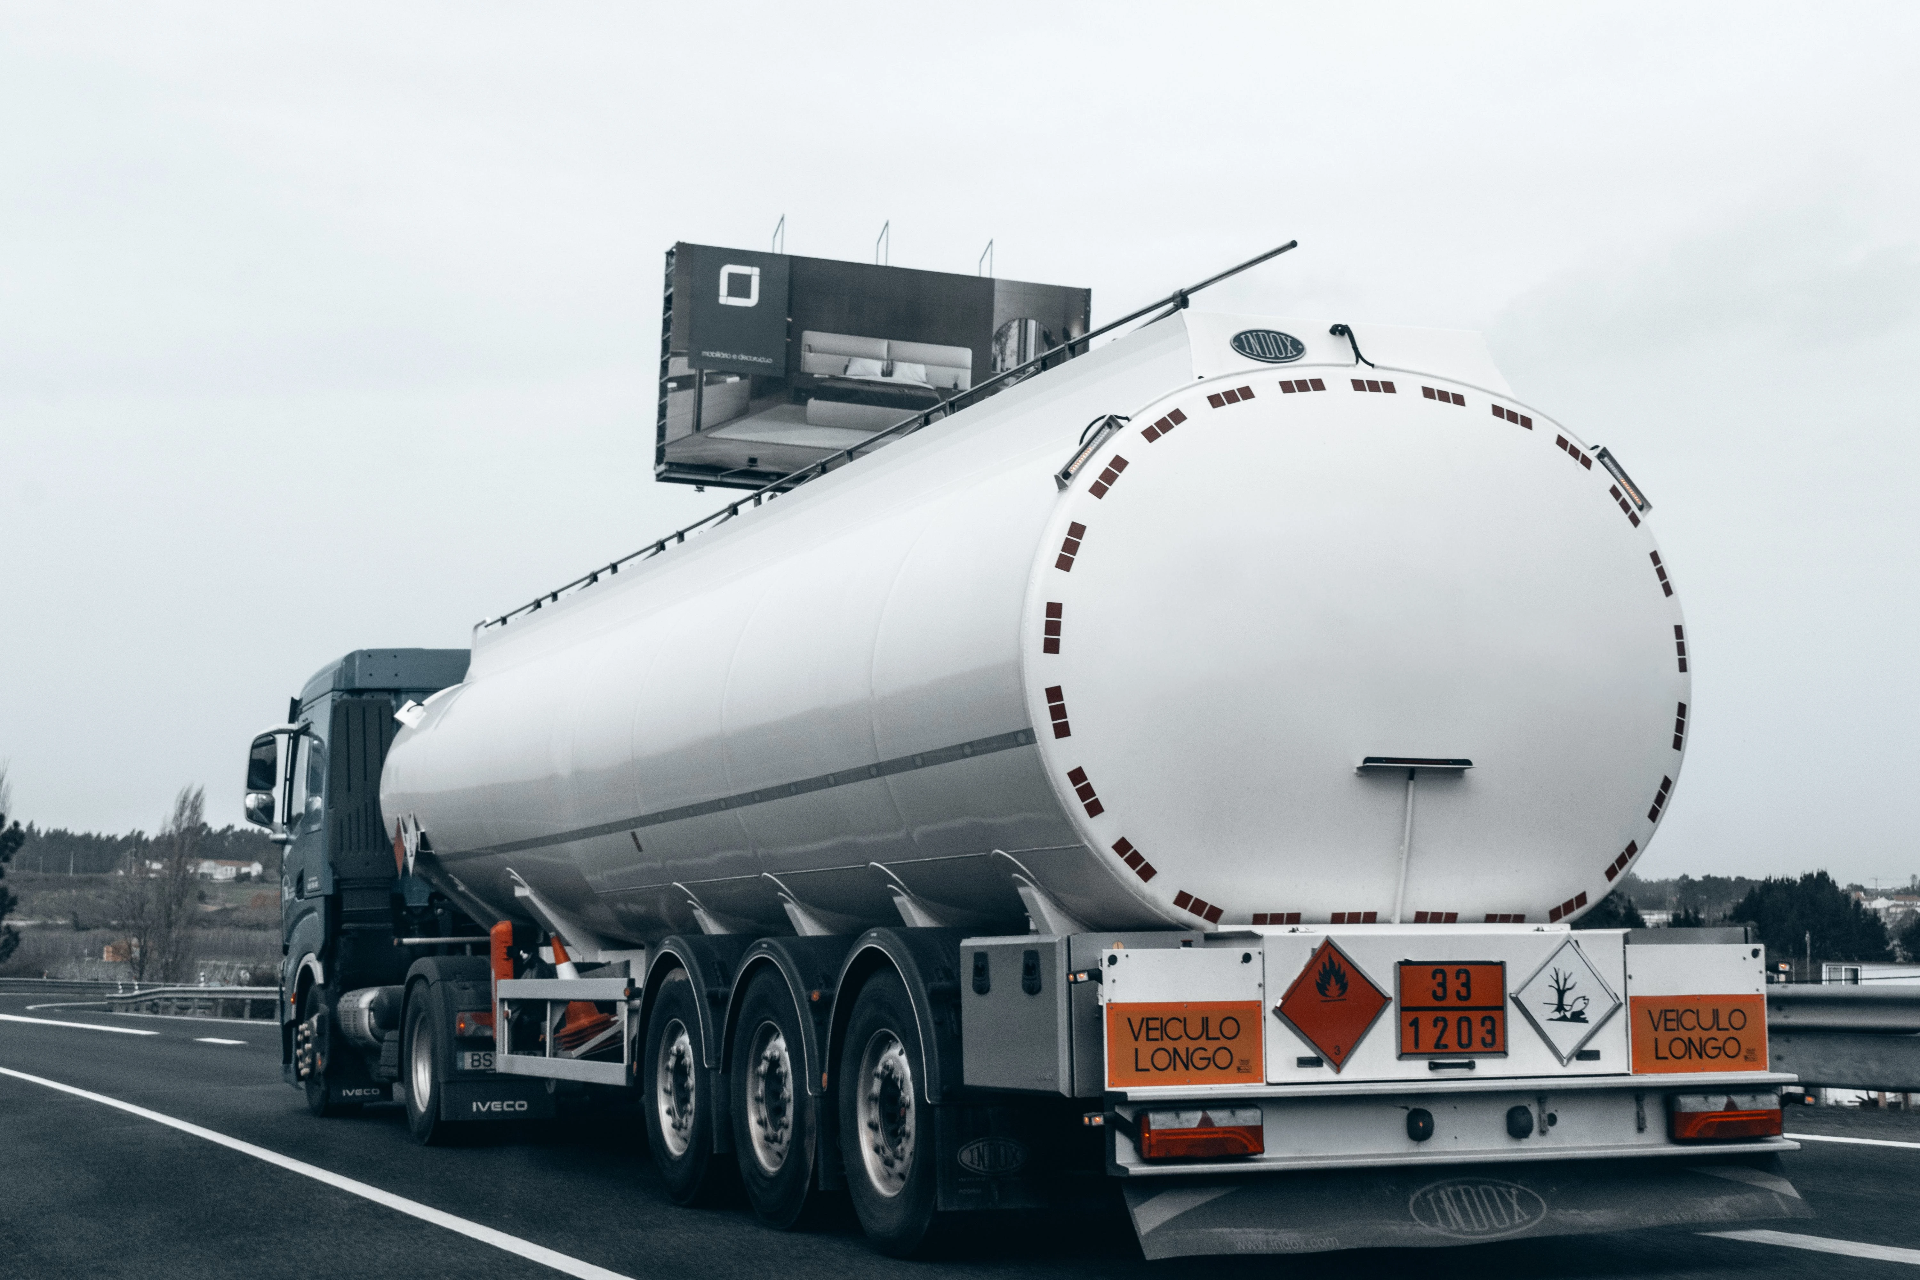
Light-duty vehicles — regular cars and SUVs — are the single largest source of the disparity. They account for roughly 60 to 70% of the absolute gap in exposure.
But when the researchers isolated which vehicle type hits people of color hardest relative to their own exposure, heavy-duty trucks stood out. For Hispanic Californians, the disparity tied specifically to heavy trucks was consistently larger than the disparity tied to passenger cars — even though trucks contribute less to total pollution statewide.
Different vehicles. Different mechanisms. Same direction.
Reducing the average isn't the same as closing the gap
The paper's central argument is unglamorous and easy to miss in a press release: a policy can succeed by every aggregate metric and still fail to touch relative inequality, because emissions reductions tend to happen everywhere roughly proportionally — including in the places that started out cleanest.
If a place was less polluted in 2000, it's likely still less polluted in 2019, just by a lower number on both ends. The ranking doesn't change. Only the scale does.
The researchers are direct about what this means going forward: electrification and similar fleet-wide strategies, if applied evenly across the state rather than targeted at overburdened communities, are likely to repeat the same outcome — real, measurable improvement, with the disparity intact underneath it.
The core question hasn't changed
Emissions policy in the US is built sector by sector — vehicles, industry, power plants — each regulated on its own track, each judged by its own statewide average. That structure is good at producing aggregate wins.
It is not built to ask where those wins land.
A 65% reduction is real. So is a widening gap. Reporting one without the other isn't dishonest — it's just incomplete, in a way that happens to favor the version of the story that's easier to announce.
Source: Koolik et al. Sci. Adv. 2024. DOI: 10.1126/sciadv.adn8544
Read the full article