
India has some of the most polluted air on the planet. This much is known. What hadn't been studied — until now — is what that actually costs, city by city, measured in deaths per day.
Jeroen de Bont and Bhargav Krishna led the first multi-city study to do this directly. Their team tracked 3.6 million deaths across ten Indian cities — Ahmedabad, Bangalore, Chennai, Delhi, Hyderabad, Kolkata, Mumbai, Pune, Shimla, and Varanasi — between 2008 and 2019, and measured how daily PM2.5 concentrations moved with daily mortality. The paper was published in The Lancet Planetary Health in July 2024.
There is no safe level
A 10 μg/m³ increase in PM2.5 was associated with a 1.42% rise in daily mortality. That number goes up to 3.57% when the analysis isolates locally generated pollution — the kind that stays close to the ground, from waste burning, diesel generators, and traffic — rather than pollution blown in from elsewhere.
The exposure–response curve has a shape that matters: risk climbs steeply at lower concentrations and levels off at higher ones. This is counterintuitive. The cities that register the sharpest mortality increases per unit of pollution aren't Delhi or Varanasi — they're Bangalore and Shimla, where concentrations are lower. The body's response to a 10 μg/m³ spike is more severe when the baseline exposure is lower to begin with.
The researchers put it plainly: there is no threshold below which PM2.5 stops being dangerous.
What India's standard allows
India's current ambient air quality standard allows 60 μg/m³ over 24 hours. The WHO recommends 15. In 99.8% of all days measured across the ten cities, concentrations exceeded the WHO guideline.
When the researchers ran their analysis only on days that fell below the Indian standard — the "acceptable" days — mortality risk per 10 μg/m³ was nearly twice as high as in the unrestricted model. The standard describes a threshold that only kicks in when pollution is already high enough that the body's response curve has started to flatten.
Clean Air Program targets — a 25 to 30% reduction from 2017 levels — fall well short of what the data suggest is needed to prevent deaths.
The figure that stays with you
Across the ten cities, 7.2% of all daily deaths during the study period were attributable to PM2.5 concentrations above the WHO guideline. That works out to approximately 33,000 deaths a year.
Delhi had the highest attributable fraction: 11.5% of deaths, nearly 12,000 per year. But the finding that runs against easy assumptions is the mortality burden in cities not typically considered high-pollution — Mumbai, Bangalore, Chennai. These cities came up too.
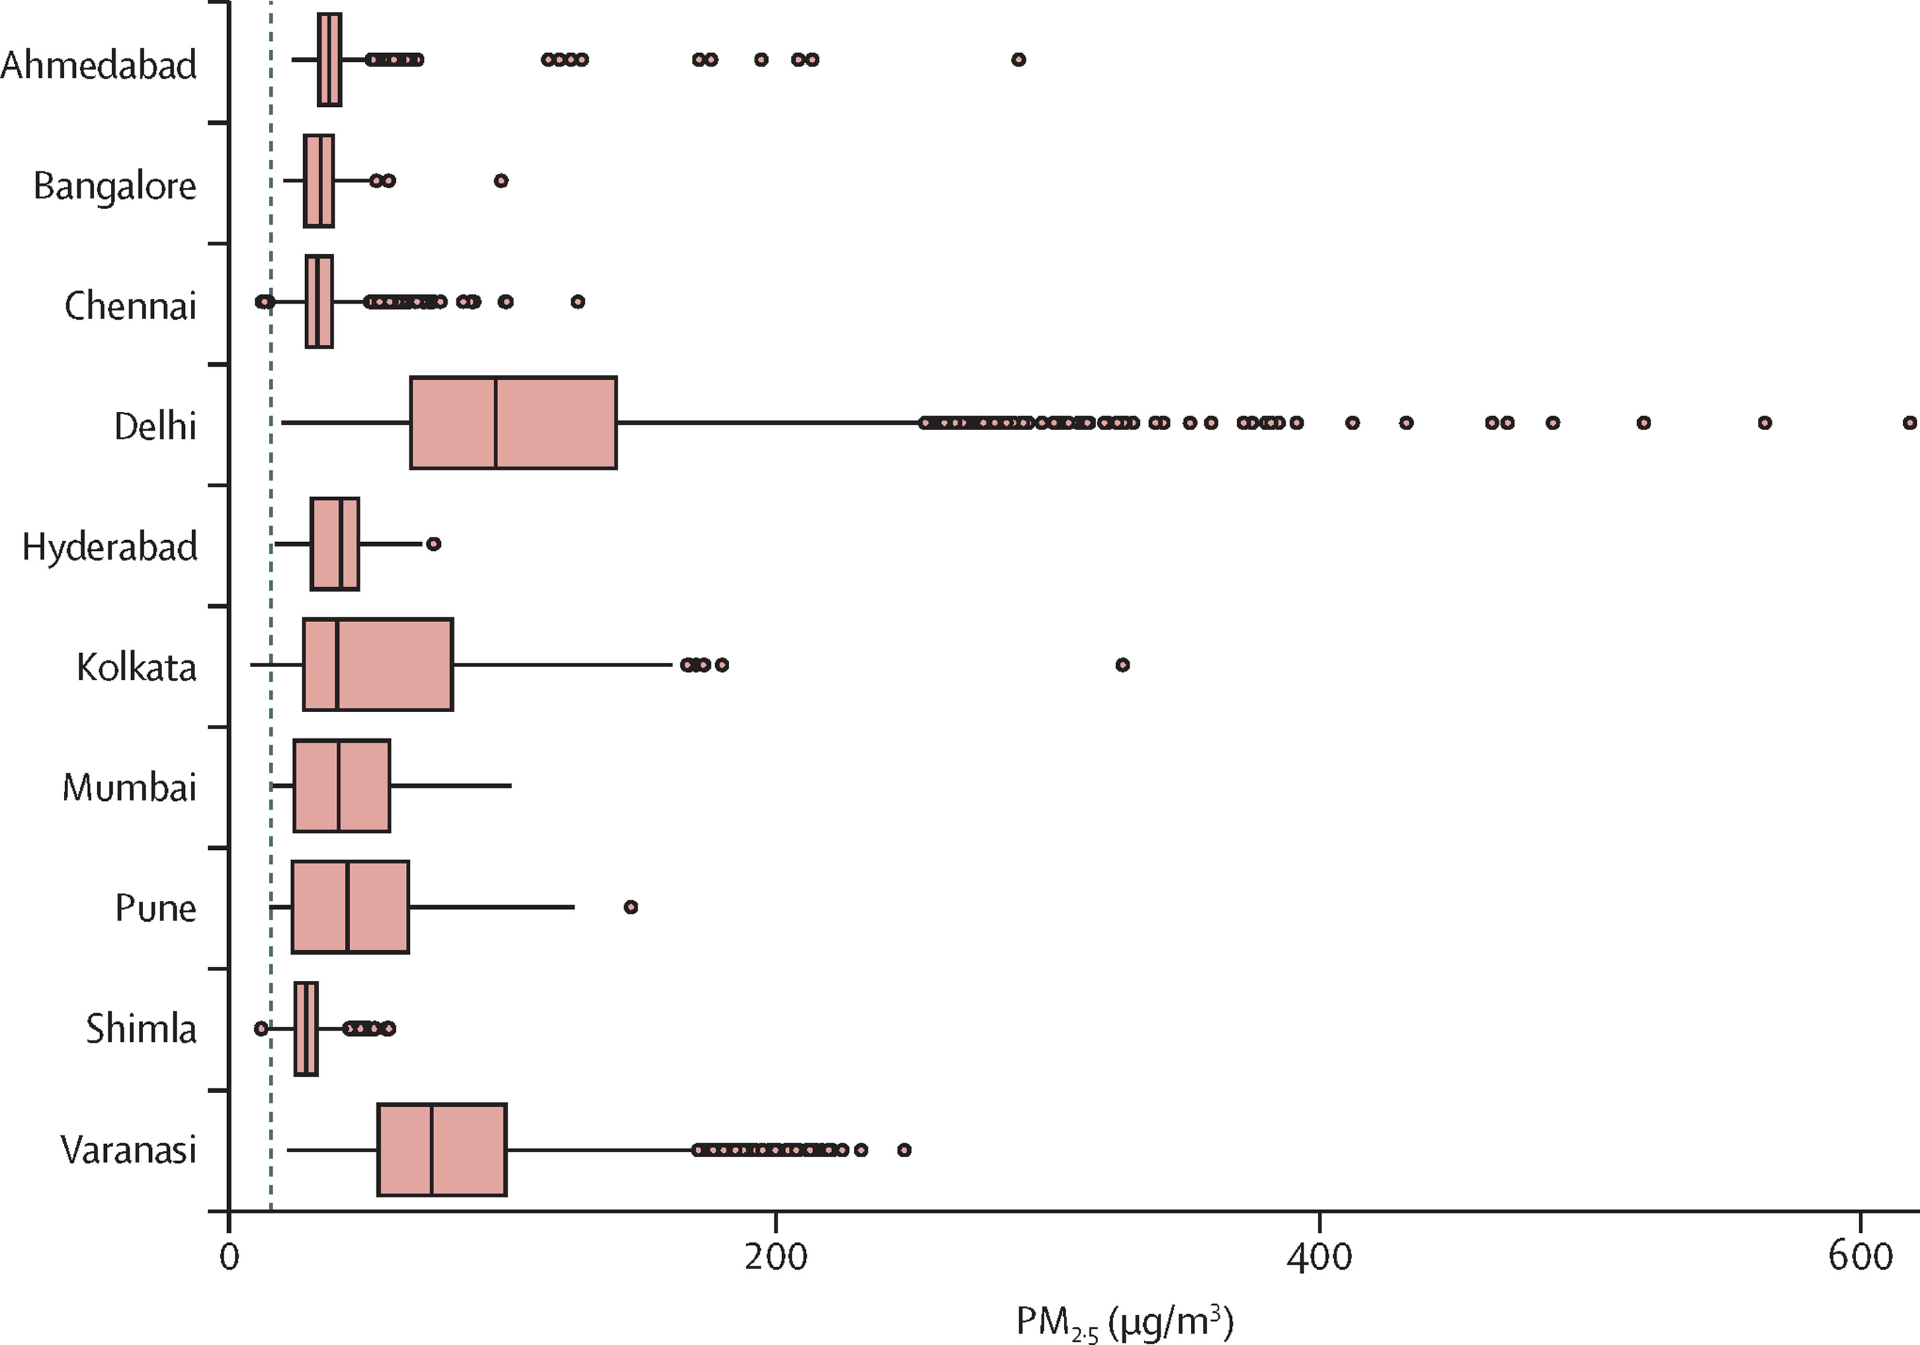
Source: de Bont, Krishna et al. (2024), The Lancet Planetary Health, Vol. 8. CC BY 4.0.
Why locally generated pollution hits harder
The instrumental variable analysis — which isolates the effect of pollution produced within a city, rather than transported in — returned mortality estimates more than twice as high as the conventional time-series approach. Local pollution, generated at ground level, is more likely to reach people directly. Waste burning and diesel fuel produce particle compositions that may also be more toxic than what drifts in from elsewhere.
India's current action plans focus heavily on fixed-point sources — industries, power plants — that lend themselves to monitoring and enforcement. They focus less on the distributed, hard-to-measure sources that this data suggests may be doing more damage.
What this adds
Until this study, no multi-city analysis had been conducted in India using causal methods. Earlier studies covered one or two cities; global multi-city analyses consistently excluded Indian cities from their samples. The standard advice to policymakers — set air quality standards based on international evidence — was met with scepticism, because that evidence didn't come from India. Now it does.
The exposure–response curve generated by this study is the first of its kind for India. It shows that mortality risk at levels below the Indian standard is not marginal. It also shows that the steepest part of the risk curve is the part the current policy framework is least equipped to address.
Source: de Bont J, Krishna B, Stafoggia M, et al. Ambient air pollution and daily mortality in ten cities of India: a causal modelling study. Lancet Planet Health. 2024;8(7):e433–e440. DOI: 10.1016/S2542-5196(24)00114-1. CC BY 4.0.
Read the full article